Master Workday Training in Hyderabad’s Leading Experts
Workday Prism Analytics Tutorial
Workday Prism Analytics
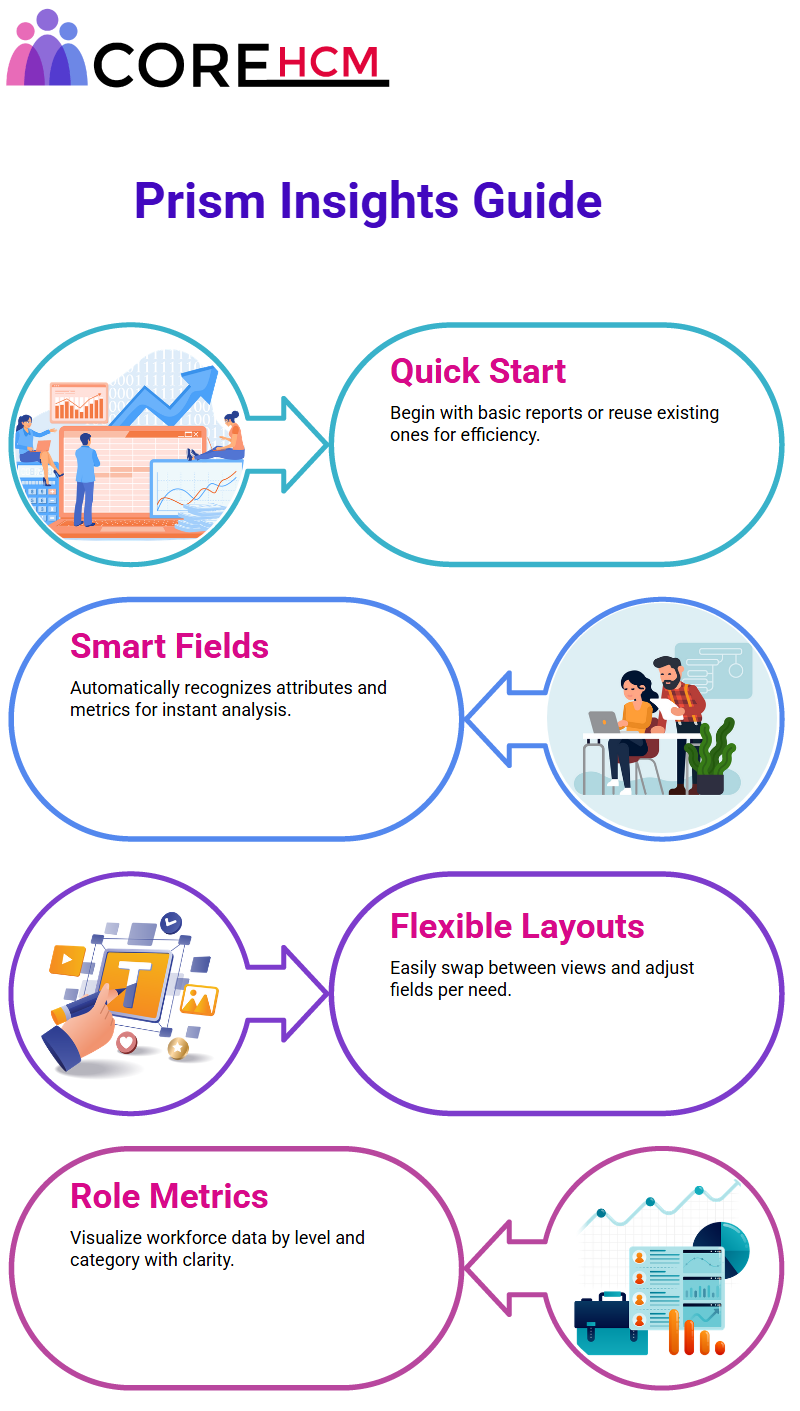
To effectively create visualizations and reports with Workday Prism Analytics Tutorial in Hyderabad, start with making simple reports or visualizations.
When more is needed, two options exist – duplicate an existing visualization or create one from scratch – both are easily achievable using this system.
Duplicating copies everything including its data source. So, for instance, if an employee details visualization is desired then duplicate and rename an existing visualization for effortless results.
Customization in Workday Prism Analytics
Next, users may explore the customization features provided by Workday Prism Analytics. When switching report types from tables or charts to charts, for instance, its drop zone automatically adjusts and additional fields like Hire Date and Management Level appear, making the customization process quicker than ever.
Unnecessary fields can easily be removed through its platform that adapts according to each report type chosen – streamlining customization as much as possible!
Fields can be divided into two distinct types, attribute fields and summarization fields. Gender would fall under attribute category while count would fall into summarization category.
Workday Prism Analytics automatically adds summarization fields for numeric or currency data sets for faster insights – for instance identifying total employee count by gender segmentation.
Reports with Workday Prism Analytics
Workday Prism Analytics makes adding custom summarizations straightforward. By default, it creates summarization fields with numeric or currency values; but users can customize this function further to calculate additional job counts for gender groups instead – providing insight not only into employee count figures but also their contributions.
One of the key advantages of Workday Prism Analytics Tutorial in Hyderabad lies in its flexibility with advanced capabilities.
Parameters like management level can easily be added to visualizations; these attributes may then be placed along an axis or used as color dimensions – offering users with quick and easy visibility over management levels across gender lines.
Workday Prism Analytics basics of Discovery Boards
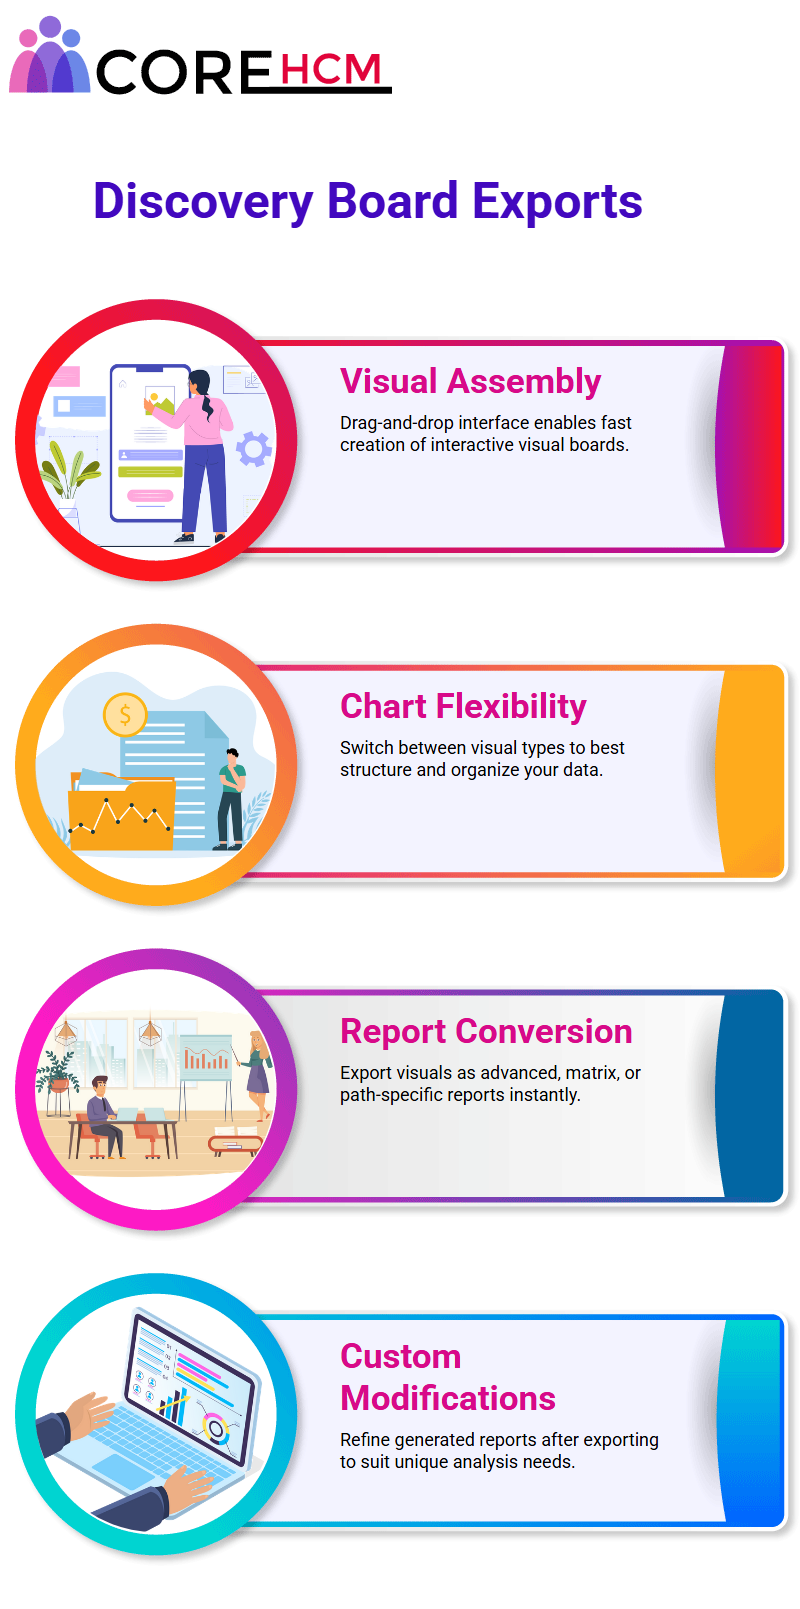
Discovery boards in Workday Prism Analytics Tutorial in Hyderabad are extremely intuitive to use; elements can simply be dragged and dropped onto an image to form visuals quickly – for instance a discovery board was saved within mere seconds.
Such versatility makes these boards indispensable tools in Workday Prism Analytics.
Visualization Types in Workday Prism Analytics
Workday Prism Analytics Offers Multiple Visualization Types While working with Workday Prism Analytics, various visualization types will likely come into play.
A chart might appear as a matrix depending on which visualization option was selected; by clicking options and changing to advanced reports; this distinction plays an integral part of its organization of data by Workday Prism Analytics.
Once everything has been assembled, discovery boards or visualizations can be exported for further examination.
Exporting any visualization will generate its own custom report within Workday Prism Analytics Tutorial in Hyderabad for advanced reports this results in an advanced report; matrix reports result in matrix reports; while exporting table visualizations yields reports classified as path types.
Workday Prism Analytics Exporting and Modifying
Let’s delve deeper into exporting with Workday Prism Analytics. When certain visualizations such as those organized under advanced or matrix categories are exported, Workday Prism Analytics creates customized reports.
Advanced visualisations create advanced reports while matrix ones yield matrix ones; all but some visualizations cannot be exported, which Workday Prism Analytics Tutorial in Hyderabad utilizes groupings for such situations.
Once exported, reports can be instantly named and viewed immediately in Workday Prism Analytics.
Further modification is also allowed so as to meet specific needs; making Workday Prism Analytics an extremely powerful way of turning data insights into actionable reports.
Prism Data Sources in Workday Prism Analytics
One of the hallmarks of Workday Prism Analytics lies in its capacity to work seamlessly with Prism data sources and Prism business objects – for instance gender can be used as a grouping criterion to calculate total job counts per gender based on unique job counts accumulated.
Throughout each gender grouping criterion – making Workday Prism Analytics Tutorial in Hyderabad an indispensable solution for data analysis and reporting needs.
Maximizing Workday Prism Analytics Employee Base Pay
Workday Prism Analytics makes the power of identifying maximum employee base pay apparent.
To begin this process, data must first be organized by supervisory organizations before selecting names of individual supervisors to group data into units according to base pay in descending order.
Workday Prism Analytics Tutorial in Hyderabad streamlines this process, offering seamless exploration of employee base pay in every supervisory organization.
Sorting and grouping results come naturally thanks to an intuitive interface; sorting base pay descending allows efficient identification of top pay levels.
Workday Prism Analytics Handling Null Values and Creating Public Data Sources
Workday Prism Analytics’ Public Data Sources can assist users in dealing with null values by eliminating them via Public Data Source (PDS) creation.
Prism Analytics allows users to ensure no null values exist within data sources, making analytics precise and clean.
Workday Prism Analytics allows employees to incorporate gender into analysis.
The tool helps simplify partitioning data based on gender within supervisory organizations while simultaneously calculating maximum pay levels for females, males, or even null gender categories, providing insightful views into any potential pay gaps or disparities that exist between gender categories.

Partitioning Workday Prism Analytics Data with Ease
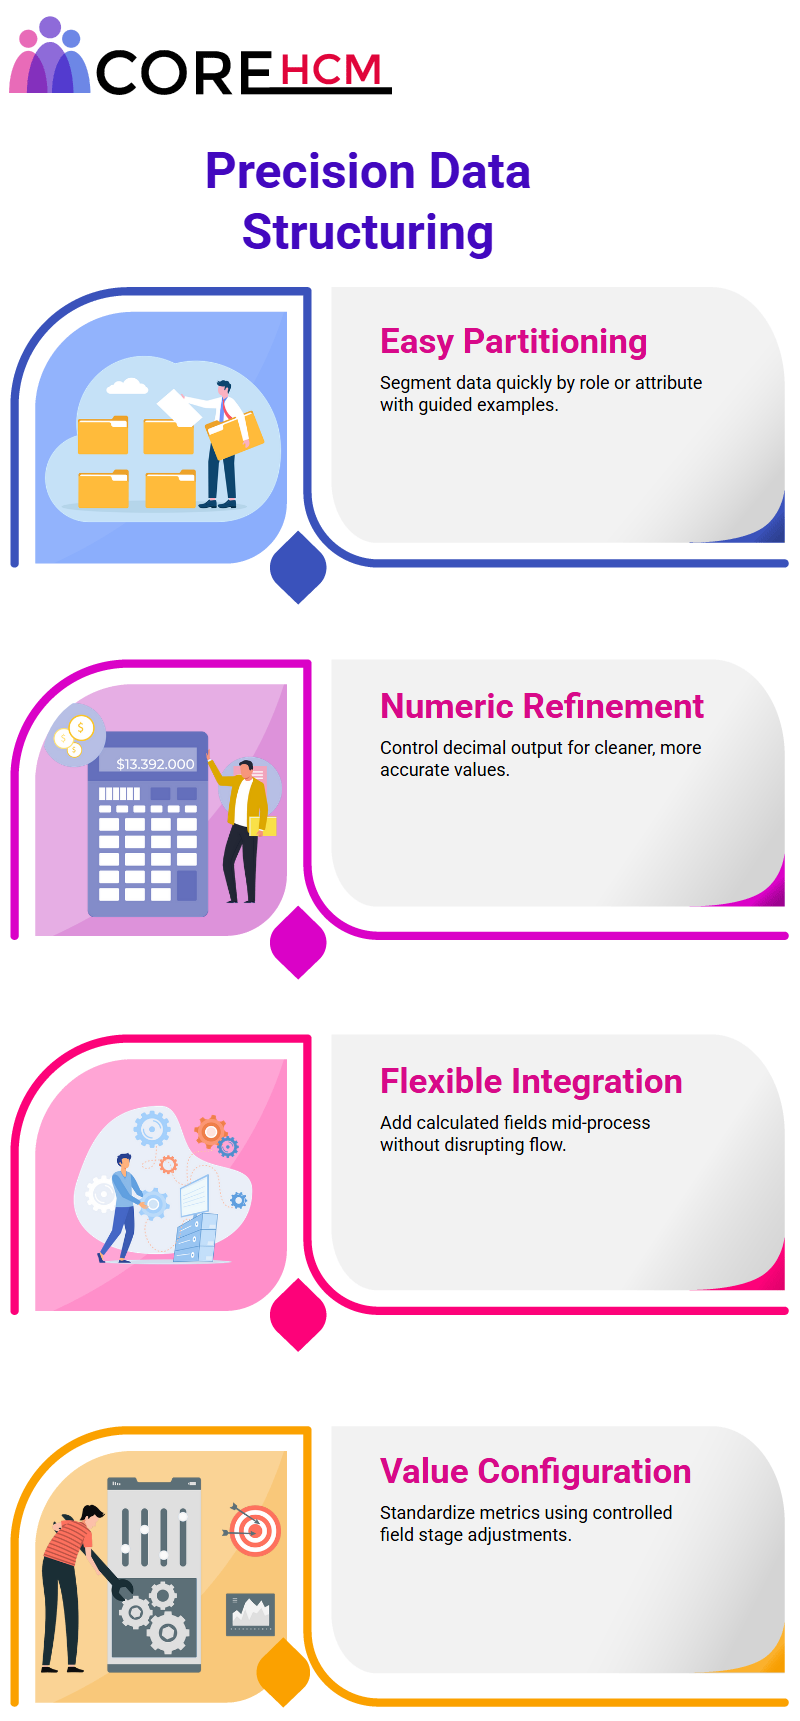
Workday Prism Analytics makes partitioning data an effortless endeavour, providing many excellent examples based on supervisor names and gender.
Furthermore, its flexibility enables deep dives into pay related metrics across organizations.
Workday Prism Analytics gives access to detailed use cases within the community, offering examples for grouping and sorting functions.
Its ease of use makes this an accessible solution; even those with less experience can utilize its functions effectively – it really is simpler than you think.
Calculated Workday Prism Analytics Fields to Accurate Data
Workday Prism Analytics has one of the standout features when it comes to numeric values – calculated fields allow numeric values to be refined to two decimal places for precision in numeric management and adjustments can be made at any stage of creation or adjustment of calculated fields within joint stages for seamless integration.
Workday Prism Analytics Tutorial in Hyderabad makes creating calculated fields easy. From adding these fields to joint stages or managed field stages, data can be cleaned up swiftly for analytics processes with precision and efficiency in mind.
This flexibility provides unparalleled precision throughout analytics processes.
Workday Prism Analytics and Managed Field Configurations
In one situation, an additional managed field stage was added due to existing values not meeting requirements – for instance age on hire and employee base pay amounts were showing multiple decimals places up to eight.
Since nobody needs such precision in these numbers for age or pay amounts a numerical value with two decimals places was selected instead utilizing Workday Prism Analytics’ managed field stage where values could be defined and saved effectively over time.
Workday Prism Analytics Building Metrics and Dashboards
When clients needed scorecards, the first step was ensuring all relevant data was available within Workday Prism Analytics.
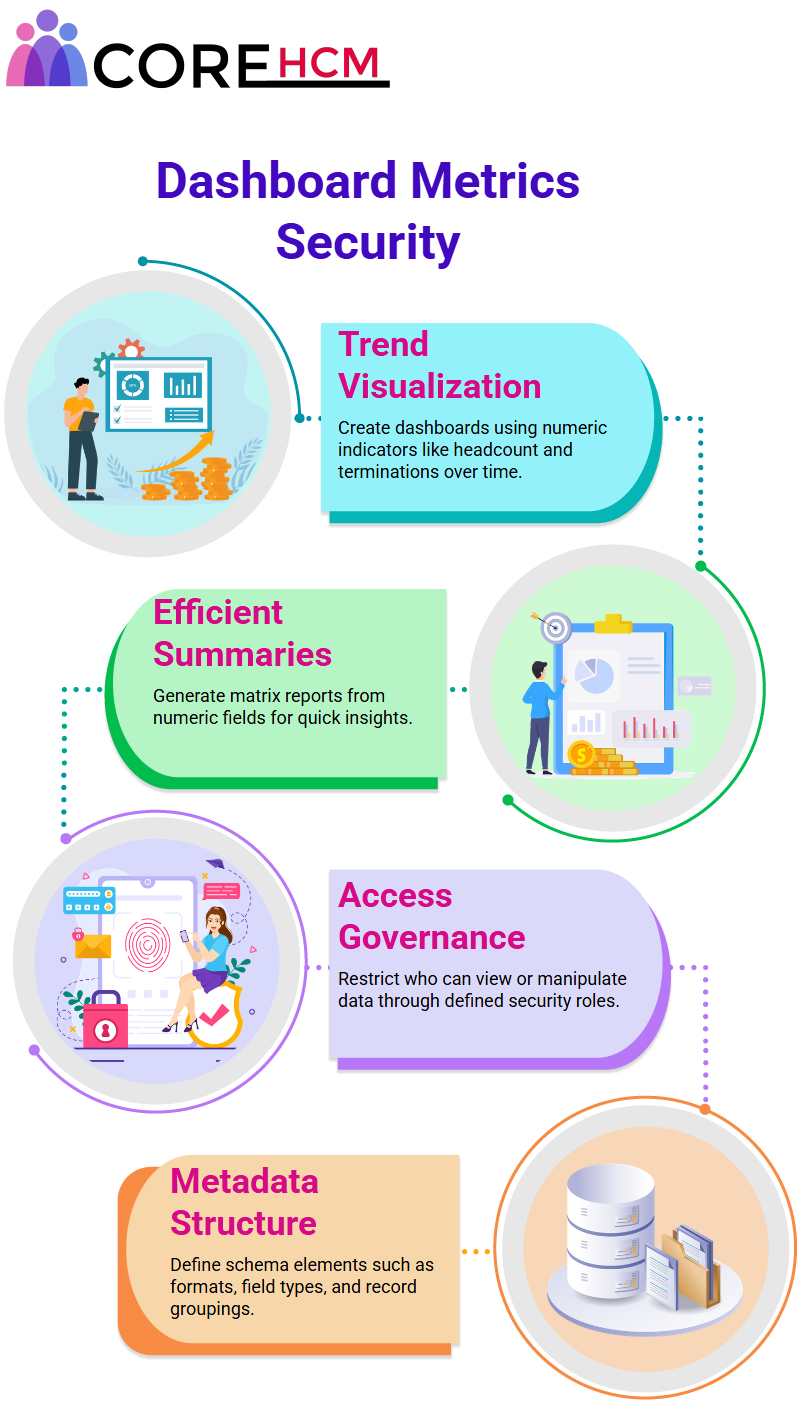
High-level trend summaries require accurate metrics such as headcount or termination count counts that could then be visualized through dashboards created within Workday Prism Analytics.
From numeric values being input through calculations generated using composite reports through to creating meaningful dashboards like those displaying headcount trends over various timeframes using Workday Prism Analytics Tutorial in Hyderabad it made the process easy to visualize complex trends through visual means that worked its magic on providing digestible insights in an easily consumable fashion.
Summarizations Workday Prism Analytics and Data Management
Workday Prism Analytics brings powerful capabilities for data summarization.
To quickly access specific values when summarizations are necessary, the initial step should be identifying them; an example would be creating a matrix report from Prism data source in order to efficiently count headcount.
It should also be remembered that summarizations only apply to numeric values; trying to summarize non-numerical attributes like gender cannot be done effectively.
Workday Prism Analytics excels with case functions, which are essential in producing efficient summarizations.
Furthermore, Prism acts as an invaluable data feed into scorecards; further emphasizing its security capabilities.
Tom reports with security measures in mind that only individuals with appropriate permissions are able to view relevant data; once in Prism’s environment however, accessibility changes; granted access to any dataset allows all the data even those not initially accessible.
Workday Prism Analytics places great emphasis on security. Workday Prism Analytics Tutorial in Hyderabad uses a five-phase process: gathering data into its base dataset, creating and transforming datasets, applying security, publishing the results for analysis and finally publishing and publishing results back out.
Workday enforces its security model during these first two steps by only permitting approved individuals from creating or editing datasets.
Workday Prism Analytics’ focus is also on metadata. Metadata describes the schema of tables and datasets, such as field types, orders and formats used.
A dataset encompasses both its definition and subset of data that typically represent rows; only individuals granted access can see both metadata as well as data rows within its definition.
Workday Prism Analytics Controlling Access and Metadata
Controlling access to data within Workday Prism Analytics is straightforward. Security domains allow you to easily configure who can create, edit or manage datasets – those without permission cannot view any of its data at all.
By configuring security domains for base and derived datasets you ensure proper control is in place.
Workday Prism Analytics and Data Security Workday’s Prism Analytics ensures data security on its platforms.
While custom reports come equipped with contextual security measures, Prism datasets offer wider access if granted permissions by administrators.
Workday’s phased approach to security ensures data remains protected while remaining accessible for authorized personnel.
Power of Workday Prism Analytics Data Security
Workday security domains allow for comprehensive management of dataset accessibility. Prism Analytics features robust tools for summarizing, transforming, and protecting data – offering users maximum user access while protecting it at the same time.
It provides an outstanding platform which balances user accessibility with data security seamlessly.
Workday Prism Analytics: Exploring Data Sets Imagine having access to datasets beyond what could be offered via contextual security reporting.
While reporting may limit viewing details about only your employees but all employees in the US.
Workday Prism Analytics eliminates these restrictions when dealing with datasets; all fields and rows can always be seen freely regardless of source or origin.
Workday Prism Analytics Makes Data Sharing Easier
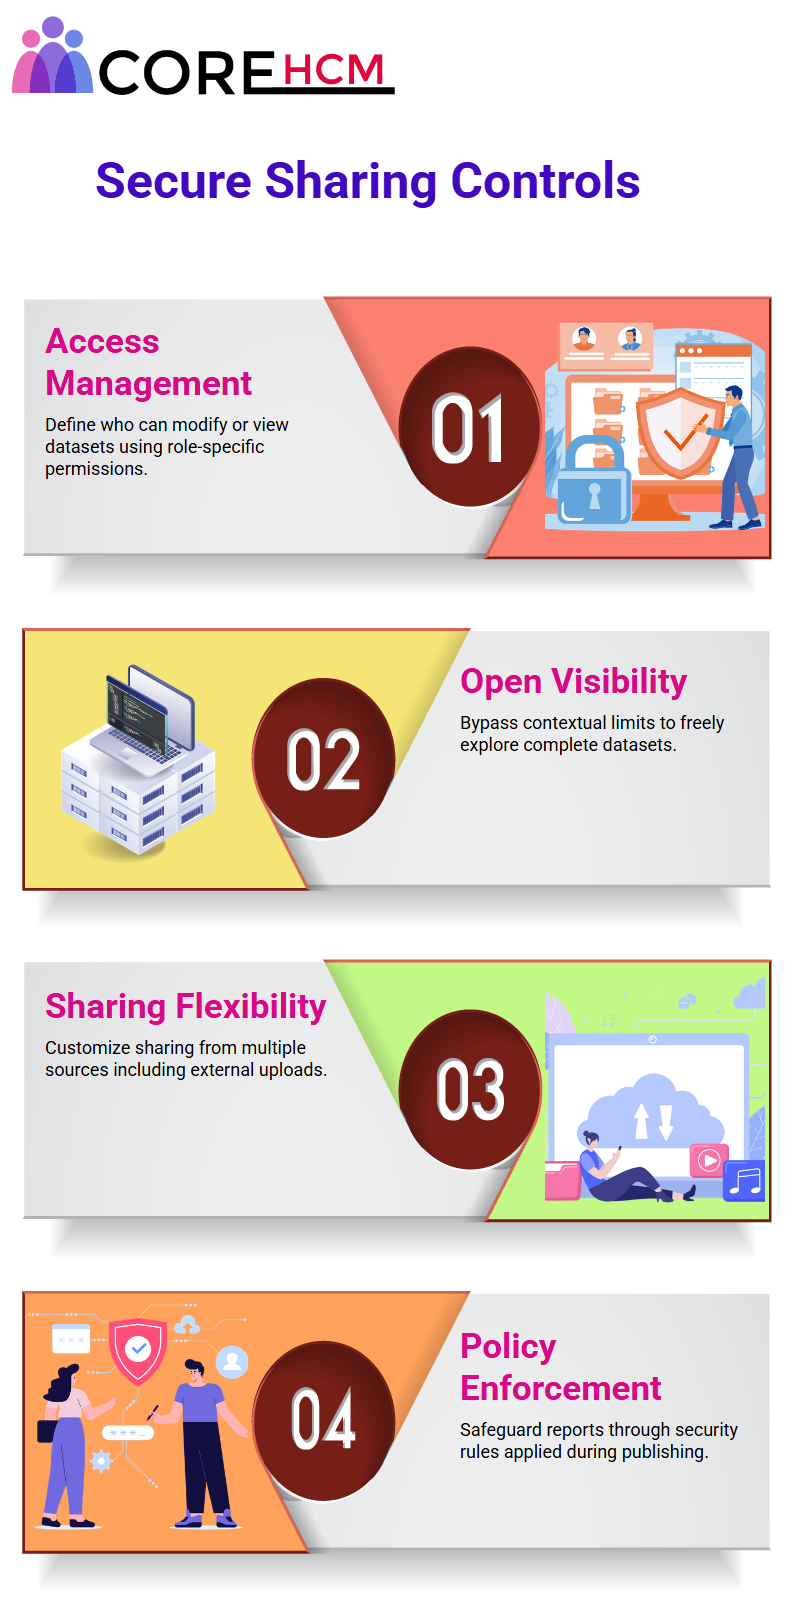
With Workday Prism Analytics’ innovative concept of dataset sharing, users are given control of who can view or modify their datasets created – whether from custom reports, an SFTP file or other sources – as well as who may access or view or manage these creations.
Access levels can also be tailored based on user needs for maximum convenience and control over who can manage, view or access any created datasets created.
Applying Security in Workday Prism Analytics
Workday Prism Analytics’ distinguishing feature is its application of security to published data. When publishing data sets, Workday Prism Analytics Tutorial in Hyderabad creates a data source where all restrictions are enforced – similar to standard databases.
While proper security alignment ensures reports remain accessible only by authorized users – an essential feature when adhering to global security strategies, either independently managed or with help from dedicated teams.
Publishing Datasets in Workday Prism Analytics
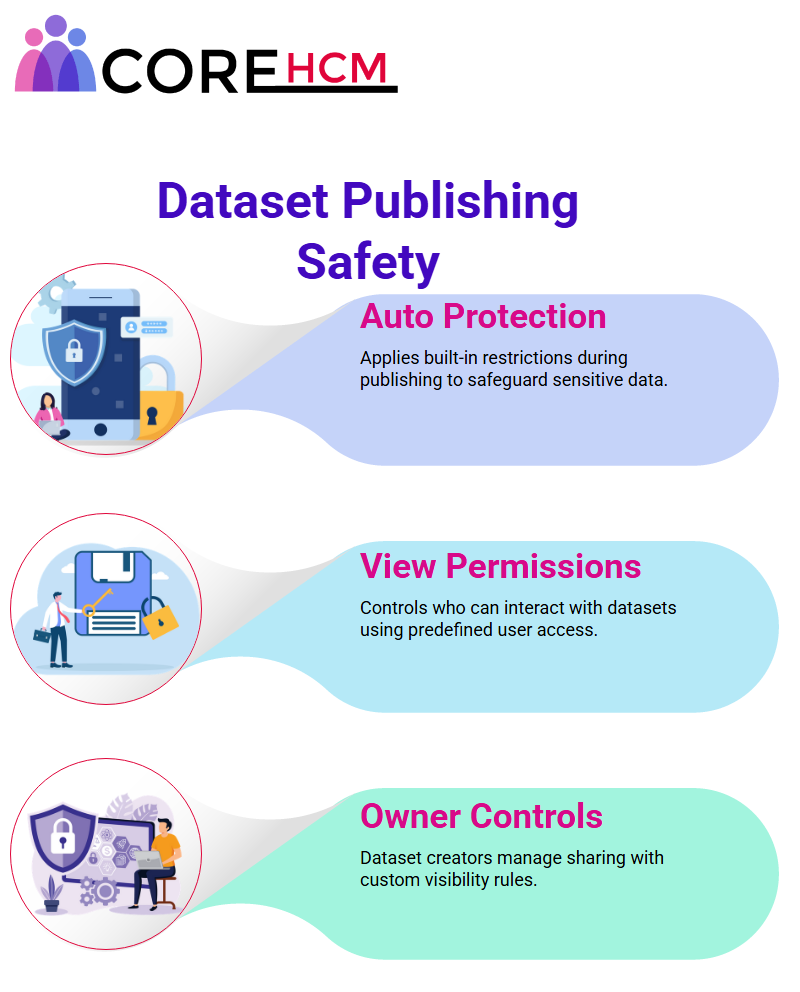
Once the publish button on a dataset has been clicked, Workday Prism Analytics seamlessly creates a Prism data source preloaded with transformed data from it – yet no explicit security rules need to be set: Workday Prism Analytics will still ensure there’s protections in place.
This security option, known as ‘prism default to dataset access,’ ensures that only individuals with permissions for data source views can view it, so even without adding explicit restrictions the information remains safe and only accessible by authorized personnel.
How Workday Prism Analytics Applies Security?
Workday Prism Analytics goes further than simply creating data sources – it also applies domain security automatically, making sure that only authorized individuals can access published information.
This implicit protection acts as a safety net in cases when explicit settings haven’t been applied explicitly.
Workday automatically applied domain security when publishing DDS-01 dataset, to ensure only those who had access to original dataset can interact with Prism data source – creating an invisible barrier against unauthorised users accessing or altering it.
Workday Prism Analytics makes managing access to datasets easy. There are two approaches for controlling access: assigning permission to view, create or manage datasets; or sharing by the owner themselves – providing your organization with flexibility in how data is accessed and utilized within your business.
Workday Prism Analytics provided me with peace of mind during my work with DDS-01 by offering its default security protocols to ensure my data source remained safe from abuse or collusion, increasing confidence among its users and collaborators.
Data Sharing in Workday Prism Analytics Do you ever wonder how to securely share a dataset within Workday Prism Analytics?
Once the final dataset has been produced, it can then be shared with specific users such as Steve Morgan or others via additional actions and security settings where source security and dataset security can be managed.
To start sharing datasets securely using Workday Prism Analytics: here’s the way it works
If a dataset has yet to be shared, only its owner or Prism administrators have access. Once sharing has been enabled in Workday Prism Analytics, simple access control options allow administrators to easily manage who can view its contents by assigning specific permissions for specific individuals or groups ensuring only relevant individuals access its contents.
Permissions in Workday Prism Analytics
When sharing data through Workday Prism Analytics, two different permissions may be applied: view mode allows only recipients or groups access to view it; the second permission type grants full control to make edits within it.
Edit mode provides greater control, and ownership can even be transferred between users.
This system works similarly to Google Drive in that users’ permissions can be tailored individually or collectively; using assignable rules that specify who may access and modify data.
As an example, when searching for roles such as manager or HR partner, the system displays their access restrictions based on these pre-set rules.
Assigning Roles and Establishing Security within Workday Prism Analytics Tutorial in Hyderabad Let’s dive deeper into role assignments within it.
Each role, like data analyst or HR administrator, comes with its own set of restrictions; when searching for manager roles the system automatically assigns permissions based on pre-configured profiles while other roles, such as HR partner may require manual assignment as per assignable rules.
This configuration ensures that datasets can only be shared with appropriate security groups; for instance, only users with data analyst roles have access to certain datasets – this level of protection helps keep sensitive information safe.
Dataset Sharing and Access Control in Workday Prism Analytics
There are specific considerations when sharing derived datasets within Workday Prism Analytics. In order to share it with someone, all datasets that feed into it must also be accessible this ensures consistency and integrity across the board.
When working with derived datasets, sharing both their base datasets as well as those feeding into them helps ensure data integrity within Workday Prism Analytics.
At its core, data security means governing who has access to particular datasets themselves. Permissions to these datasets are assigned based on work-based security policies, which is essential when managing sensitive information.
Security groups can help simplify access management. A security group consists of users with similar permission needs; for instance, data analysts could form one to gain access to relevant datasets more efficiently.
Workday Prism Analytics security groups bring together users who possess similar roles and responsibilities, streamlining access permission management while improving user satisfaction with this process.
Implementing Workday Prism Analytics Multi-Level Security and Permissions
The second level of security applies to published datasets. To do so, first define data source security before publishing any dataset; Workday Prism Analytics automatically enforces implicit security, yet explicit configuration options can still be applied as desired.
Workday Prism Analytics makes applying explicit security easy. Simply by accessing additional actions and editing data source security settings, security settings can be specified specifically for the data source created when publishing a dataset.
Workday Prism Analytics in Hyderabad offers the same capabilities, enabling localized teams to implement these controls efficiently.
It also permits locking down specific rows or columns within datasets for more advanced security needs.
This security control simple through domains. When creating data sources, their security can be managed using custom domains like number 103; Workday also offers predefined domains which serve various functions.
Permissions for these domains are granted by security teams, with specific team members having access based on their roles and roles alone.
It makes applying permissions on a granular level possible.
Security Items in Workday Prism Analytics
The role of domains and security items is central to Workday Prism Analytics, with security groups serving users who require equal access and domains being responsible for grouping related reports, tasks, data sources or fields like employee date of birth together into groups for easier management.